
I recently shared a paper of mine entitled “Composite Tailored Regression Modeling For Evaluative Ratings in Professional Hockey” after it had unfortunately been rejected by a sports analytics journal. In it, I introduce a metric I’ve developed called K, explore the underlying math and discuss applications. It is now available here and I strongly urge you to read it in its entirety for a fuller understanding of the model. For the less mathematically-inclined, this post will serve as an introductory explanation of the fundamentals.
K is what I’m calling a composite tailored regression model. In simple terms, it means that it is made of multiple elements, and that each element is optimally accounted for. The main tenets are that hockey can be separated into various independent processes by which goals are scored, and that each of these may be represented by a tailored regression. The purpose of this piecewise approach is to avoid generalization by selecting parameters dependent on the nature of each process and the regression method that best suits it. Additionally, this yields a component-based product that mustn’t necessarily be summarized in a single number. Ratings are given by an agent’s influence on each of these processes by acting as a variable in the regressions. Agents may be teams, skaters, goaltenders or theoretically other entities that participate in games by exerting an influence on these processes.
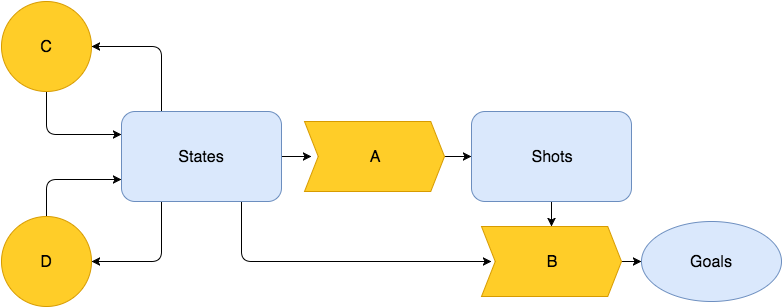
I posit that goals are directly or indirectly produced by four distinct processes and that each can be modeled with agents acting as explanatory variables. They are:
A. The rate of shots for or against a team
B. The likelihood of a shot becoming a goal
C. The rate of penalties taken for or against a team
D. The game state or context of imminent play
The model is equipped with starting assumptions about which agent classes are expected to impact which of the above processes. For instance, goaltenders are assumed limited to influencing the goal probability of shots taken against them (B).
Elements A and C are approached as survival problems. This branch of statistics is used for time to event data where it is sought to understand how various predictors impact the rate at which an outcome is observed. A Cox proportional hazard regression is used here, with shot attempts and penalties serving as events for A and C respectively. Observations are right-censored by player substitutions. In addition to all agents of the type under observation, indicators for a variety of game states act as covariants in the regression. Thus, the coefficients given for any one agent reflect its partial contributions after controlling for the influence of all other agents (for skaters, this is interpretable as adjusting for Quality of Teammates and Competition) and game state. The contextual factors accounted for are strength state, score state and zone starts. An offensive and defensive coefficient is produced for each agent. The natural exponent of each represents a multiplier on the baseline rate of events, such that a null coefficient β = 0 multiplies the rate by 1. Negative coefficients depress the rate of events, while positive coefficients increase it. For an agent with offensive and defensive coefficients Ω and δ, the goals added on offence and defence may be written as:
![]()
![]()
Where α is the baseline rate and Ψ is the average goal value of a shot.
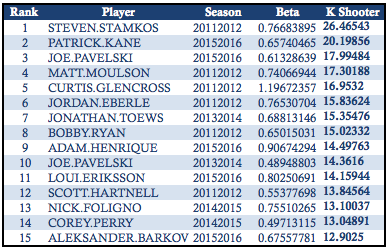
B takes the form of a binomial logistic regression. Agents once again act as predictors but may assume different roles. An agent may impact the scoring odds of a shot by acting as the shooter or goalie, or by playing a supporting role – on the ice for either team as a non-shooter. Teams are said to act as shooters or goalies, while skaters may play the role of shooter or support for and against the shooting team. As in the previous case, indicators for a range of game states are controlled for by their inclusion as explanatory variables. The coefficients yielded in this regression are similarly converted to goals added. Listed below are the top skater-seasons since 2011-12 based on goals added in the role of shooter:
To elaborate on process D, remember that we’ve adjusted for game state in each of the regressions yet performed. This would suffice if we ignored the very real possibility that skaters themselves may impact the state of the game with respect to strength, score or face-offs. In fact, process C is one such example. We escape the need to account for the influence skaters have on the game’s score by virtue of goals being the very product of the model. Any component relating to the impact of the score change on subsequent goals is implicit in the value of a goal added. This leaves zone starts, on which a skater can exert their influence by earning face-offs in each of the three zones. I use a multinomial logistic regression to model this effect, where four possible outcomes are given by a shift end resulting in each of three possible zone starts or none at all. The usual game state indicators are included as variables. The number of outcomes added of each type is multiplied by the average goal value of that outcome to obtain goals added.
Each regression is regularized using the elastic net method and cross-validated to optimize out-of-sample predictions. Through variable selection, only a subset of agents are given nonzero coefficients. These measures are in place to prevent overfitting.
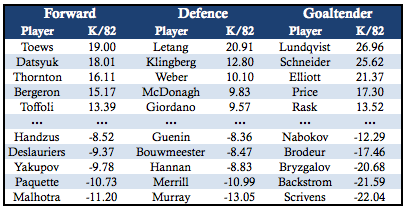
K is the sum of goals added by an agent through each of these four processes, relative to a neutral agent – that is, one that has neither a positive nor negative impact. Let K/82 be defined as the goals added per 82 games played. The top and bottom five regular players at each position over the last five seasons are listed below:
The five best team-seasons in the same span are Chicago 2012-13, Boston 2013-14, St. Louis 2011-12, Pittsburgh 2012-13 and Los Angeles 2012-13. in 7 of 9 seasons for which we have data, the Stanley Cup winner ranked top-5 in regular season K and in 6, they ranked top-3.
The relationship between skater K in consecutive seasons is amply statistically significant, with a P-value below 2.2E-16. Furthermore, the total K of season-opening rosters is a very good predictor of regular season team success. Team points in each of the last four seasons were predicted using a simple linear regression model with the total K of forwards and defenders in the previous season acting as variables. The experiment was repeated using Y-1 points, 5v5 GF%, 5v5 CF%, 5v5 GF% and team K. The residual standard error of the roster K model (12.95) was second only to team K (12.92). This means that the quality of a team’s roster in the first game of season as reported by the sum Y-1 K informs a great deal of how we expect the team to perform in the regular season.
As further validation, a crude predictive test was carried out on playoff series comparing a variety of regular season stats. Basic logistic regression models were designed using both teams’ regular season ratings to predict the outcomes of series. In each of 10,000 iterations, the regressions were trained on a randomly selected 80% of the total data and tested on the remaining 20%. The logarithmic loss was calculated in each case and subsequently averaged. K performed the best at 0.6488, with xGF% coming in second with 0.6848. In addition, teams with the advantage in regular season K have won 64.12% of playoff series since 2007-08.
We can observe how the allocation of TOI and salary among players generally favours those with more positive K ratings (click to enlarge):

Nevertheless, there is significant exploitable inefficiency if you assume fault lies on the side of TOI or salary cap distribution. As shown in the Q-Q plots below, the distribution of residuals is widest for goaltenders and defence (click to enlarge):

All K ratings will be available on the site soon. Given its predictive power, I strongly believe K will be the single best publicly available team metric in hockey. At the player level, multi-year K appears to be a very strong single-number rating at this stage. I hope to address current limitations in hopes of improving it further.