
EP: Throughout this post, I’ll use “qualcomp” to describe both QoC and QoT because “QoC/QoT” is tiresome.
Though we may not like to admit it, the hockey analytics collective has yet to crack the qualcomp code. The public sphere has yet to produce an agreed-upon method of weighing the impacts of QoT and QoC and the latter is sometimes dismissed outright. Traditionally, TOI-weighted averages are employed to determine the mean talent of teammates and opponents. The talent component may differ – 5v5 TOI% and Corsi being among the most common. On Corsica, three brands of qualcomp are offered: TOI%, CF% and xGF%. A wrinkle is that each teammate’s CF% or xGF% is calculated from the time they spent playing without the player in question. This ensures that the measured quality of a teammate is independent of the impact a player has on them. Despite this advantage, the methodology is imperfect. Namely, it introduces what I’ve come to label the Sedin paradox.
The Sedin twins are the ideal example of common linemates. Henrik has played 86% of his 5v5 minutes over the last three seasons with his brother Daniel on the ice. Through TOI-weighting, Daniel will easily represent the most important component of Henrik’s estimated QoT. However, because they play together so often, Daniel’s without-Henrik sample is comparatively tiny and thus far less significant. The reasons this quantity may be unreliable are twofold: The large variance of performance in smaller samples; and the fact so few minutes can not guarantee Daniel will have been exposed to a full range of situations in his time away from his twin brother.

The idea such unreliable quality estimates may be so heavily weighted in the QoT calculation is the Sedin paradox. I will propose using the bootstrap method to obtain estimates of variance which will serve as additional weights in the QoT and QoC formulae, and test this new measure against the current qualcomp.
Bootstrapping is a resampling method used to produce estimates for certain measures of accuracy or variance from a sample distribution. For each teammate or opponent in a player’s qualcomp calculation, the shots for and against (CF and CA, apart from the player in the case of QoT) were randomly resampled with replacement 100 times. In each iterate, CF% was calculated from the resampled distribution. The mean CF% (mCF%) and standard deviation (σ) were recorded over the 100 random samples for each qualcomp component. The new “Bootqual” formula is:
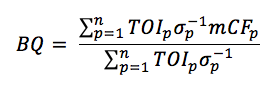
For each teammate (QoT) or opponent (QoC) p. Thus, the contribution towards qualcomp of each component is weighted by the inverse standard deviation.
This new Bootqual measure was calculated for all players in the last two regular seasons. The distribution of QoT and QoC was compared for either method among skaters having played >200 minutes in a season, and the density of absolute deviation from traditional QoT was plotted:

Outliers exceeding 3 standard deviations from the mean in any direction are indicated in red. The names of players whose Bootqual QoT differed by 2% or more are additionally shown in the bottom figure.
Evidently, the vast majority of cases result in very marginal differences. There are players, however, for whom this change in methodology causes more drastic outcomes. In the 2014-15 season, the Bootqual method increases Henrik Sedin’s QoT by 2.6% – from 44.08% to 46.68%. While this result may satisfy an itch, it is purely anecdotal and does not provide proof the new method is beneficial on the whole.
The first test performed on the Bootqual measures involved fitting a logistic regression to shot data and comparing their contributions as covariants to that of traditional qualcomp measures. To build the training data, shots taken for and against players’ teams at 5v5 were grouped according to the following game conditions:
- Score state (leading, trailing, tied)
- Session (regular season, playoffs)
- Venue (home, away)
The shot totals were then deparsed into a binary variable where 0 indicates a shot against and 1 a shot for. In addition to the game conditions listed above, the average offensive zone start ratio and qualcomp measures for that group are included as variables alongside each shot. A pair of regularized logistic regressions were fitted to the data explaining the outcome of observed shots. The observed player, score state, session, venue and zone start ratio serve as independent variables, with traditional QoT and QoC or the Bootqual versions for either regression.
The regressions were regularized using the lasso penalty and cross-validated on 10 folds to identify the optimal penalty term. The yielded coefficients are summarized below as natural exponents (e^ß):

The exponentiated coefficients are interpretable as multipliers on the base odds of a shot being taken by the team in perspective per unit increase. A 1% increase in QoT equates to an average increase of 0.7114% to the probability of a shot for using the traditional measure, and a 0.7205% increase using the Bootqual version. Meanwhile, a 1% increase in QoC equates to a -0.8204%, or -0.8100% decrease in probability on average for regular and Bootqual respectively.
The fit of each regression was compared using logarithmic loss and the percentage of null deviation explained:
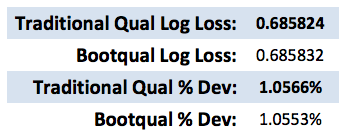
Not only does the experimental Bootqual method display negligible difference from the traditional method, it appears to perform slightly worse. A third trial was performed by mixing Bootqual QoT with regular QoC and performed marginally better, but still worse than the classic qualcomp pair.
Additionally, a CF% RelTM metric was created using either QoT version equal to a player’s CF% minus their CF% QoT. The autocorrelation of each RelTM measure was tested between the 2014-15 and 2015-16 seasons. The Bootqual brand yielded a superior R^2 value (0.3318 to 0.3236) but a slightly worse standard error (0.024487 to 0.024473). Because data were only collected for two seasons, this test was not terribly thorough and could be revisited.
My interpretation of these results is that, while superior to traditional qualcomp in unique cases such as the Sedins, the Bootqual method fails to properly take into consideration all participants in the calculation. The mean BQoC is slightly above 50%, while plain QoC is slightly below. This indicates to me that of the group of players being less importantly considered due to their small sample of play, many are replacement-level. Failing to account for the impact of facing, or playing alongside marginal NHL talent is a disappointing drawback of this method. Furthermore, the computational requirements for the bootstrapping sequence are not justified by the end product.