7 Features You Didn’t Know Existed

I get a lot of questions about the site from users looking for a specific function or feature. Realizing it may not always be evident if and where certain elements of the site exist, I thought I’d list some of the most commonly-missed or unintentionally hidden features.

1. Custom Query
The most common response from me to questions I receieve on Twitter is “Custom Query.” Each of the Team, Goalie and Skater sections contain a tab linking to this tool at the top of the page. The Custom Query provides more flexibility to users, and importantly, the ability to search stats within a given range of dates. Users may also aggregate games or keep them separate for a game-by-game view. If you need functionality absent from the standard Team, Goalie or Skater tables, this should be the first place you look. Continue reading “7 Features You Didn’t Know Existed”

2016-17 NHL Schedule

The NHL schedule for the 2016-17 season was announced today. To the best of my knowledge, there isn’t a complete consolidated schedule on the official NHL site. In any case, I gave up looking for one and compiled it myself from the JSON graciously provided to me by Greg (friend of the site!). I’m hoping to have a schedule feature/section on the site in time for next season, but in the meantime you can download the full regular season schedule here:

Dropbox (CSV)
Dropbox (RData)

As always, let me know if you spot any errors.


Adjustments Explained

Corsica offers two brands of adjusted stats. The first accounts for score state and home ice advantage, while the second additionally factors in zone starts. The method used for the former is Micah McCurdy‘s and the latter is my own adaptation thereof. In principle, McCurdy’s method looks to adjust the value of shots taken by either team involved in a game according to the score state and status of the shooting team. It’s been shown that his approach represents a significant improvement over its predecessors, namely Eric Tulsky’s Score-Adjusted Fenwick proposed in 2012. Fewer attempts have been made to develop zone start adjustment methods. David Johnson’s method of removing shots occurring within an arbitrary time span of face-offs is exceedingly crude and inefficient and hence is not discussed further.

In McCurdy’s method, the historical number of events for either team is counted for each possible score state from the perspective of the home team. For instance, when trailing by one goal, home teams have recorded 51,921 unblocked 5v5 shots while their opponents (the away team) have recorded 43,075 between 2007 and 2014. The adjustment coefficients, or weights, are selected in order to satisfy this ratio while producing a total quantity of weighted shots that is equal to the original unadjusted total. The coefficients are given by: coef(team) = [average # of events]/[# of Events for team]. I calculated these coefficients for each of shots, unblocked shots, shots on goal and goals using the complete (at the time) data set since 2007, staying true to Micah’s original formula. These weights are used for “Score and Venue Adjusted” stats.

Coefficients are similarly calculated for the “Score, Zone and Venue Adjusted” measures. Here, a more diverse array of situations are considered. A face-off can occur in any of three zones – offensive, defensive or neutral. For each event of interest, we consider the zone in which the last face-off occurred in addition to the score state. As a final property, the recency of the last face-off is taken into account. This serves to avoid generalizing entire shifts by where they began. This implicitly solves the issue of on-the-fly deployment. That is, players on the ice for an offensive zone draw receive a much different (greater) advantage than those coming on 45 seconds thereafter. The face-off start parameter is divided into two subcategories: the first 20 seconds and the remainder of the sequence. This cut-off is chosen to reflect the fact that almost all of the advantage related to a zone start is contained within the first 20 seconds of play. The seven score states are then multiplied by six possible face-off start subcategories, giving a total of 84 coefficients for both teams:

Screen Shot 2016-06-19 at 3.45.04 PM

The distribution of differences obtained with the Score, Zone and Venue Adjusted measures is much wider than simple score adjustment:

Rplot

The largest single season increase in CF% by Score, Zone and Venue adjustment over the last three years is Paul Gastad’s 2015-16 campaign, worth 7.57 percentage points. This represents an increase from 38.38% to 45.95%. Gaustad was deployed in only 31 offensive zone face-offs to 418 in the defensive zone at 5v5.

Can Mike Sullivan win the Jack Adams Award?

The first few months of the 2015/16 NHL season were rough times for the Pittsburgh Penguins.

Sidney Crosby was not himself, to say the least, head coach Mike Johnston was fired, newly acquired Phil Kessel wasn’t producing like he was expected to and the Penguins were on the outside of the playoff picture looking in.

Fast forward less than four months from the December 12th firing of Johnston and everything has changed. The Penguins now sit one point behind the New York Rangers for third place in the Metropolitan and Crosby is tearing up the NHL.

In the 28 games the Penguins played under Johnston this season, the Penguins posted a score adjusted CF% of 48.3, good for 19th in the NHL. In the 48 games since then under Sullivan the Penguins trail only the Kings in that department with a mark of 55.8%. Under Johnston the Penguins were 25th in the league in 5v5 goal scoring. In the 48 games under Sullivan they lead the league in that department- two goals ahead of the Washington Capitals. Before December 12th, the Penguins sat 15th in high danger scoring chances +/-. Since December 12th they trail only the San Jose Sharks in that department with a mark of 136. The third place Kings have a HSC+/- of 80.6 in that time frame and 74.8 less HSCF than the Penguins. Maybe the most impressive part about all of this is that the Penguins have continued on their torrid pace while missing Malkin for the past 19 games.

An obvious factor in the Penguins turnaround has been the resurgence of Sidney Crosby. The conversation has turned from “what the hell is wrong with Crosby?” to “what the hell is wrong with Crosby making everybody else look bad?” In the 28 games prior to the coaching change Crosby was posting a P/60 of 1.6. Post December 12th Crosby has posted a staggering 3.2 P/60, for reference Patrick Kane has 2.3 P/60 in that time. Crosby has climbed to third place in the NHL points race after sitting literally hundreds of spots back in the first 28 games.

When Kessel was traded to the Penguins in the summer even his biggest doubters predicted big things, but his Penguin career didn’t get off to a great start. In the three months Kessel played under Johnston, he was putting up a disappointing 1.4 P/60 but he’s been much improved since then, posting 2.3 P/60. His CF% also improved dramatically from 50.1% pre coaching change to 56.4% post coaching change. Although his CF%Rel hasn’t improved much which would suggest the improvement in that area has just been a product of the team’s dramatic improvement.

Just about the only thing that hasn’t improved for the Penguins since their coaching change has been goaltending. Up until December 12th the Penguins were third place in 5v5 sv% with a mark of .938. Since then that total has come back down to earth and sits at .926, or 13th in the NHL. Marc-Andre Fleury no longer has to stand on his head every night, he now merely has to be good and he has been.

Looking at all these numbers I would argue Mike Sullivan should win the Jack Adams Award, although in recent years the award has simply gone to coaches of teams who rode an unsustainable PDO into the playoffs. In that case, Alain Vigneault of the New York Rangers would be the recipient this season on the back of Henrik Lundqvist. Which is funny because if the playoffs started today the Penguins and Rangers would meet in a first round match up. Buckle up King Henrik, you’re about to eat some (more) rubber.

No team will want to meet the Penguins in the playoffs, Malkin or no Malkin. So, what has changed for the Penguins since those early season struggles? In a word, everything.

PensCF%

Contending without goaltending

*all stats are 5v5 unless otherwise indicated.

Over the last five NHL seasons, no NHL team has won a Stanley Cup after finishing in the bottom ten teams in the league in terms of save percentage.

In fact, only aging Martin Brodeur – to put it lightly – and the 2011-2012 New Jersey Devils have made the Stanley Cup Final after finishing the regular season in the bottom ten teams in save percentage.

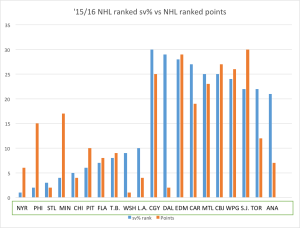
That isn’t a promising sign for a few teams who expect to contend for a Stanley Cup this spring. The high-flying Dallas Stars, the puck hog Anaheim Ducks and the heating up San Jose Sharks all find themselves in the bottom tier in that area.

The most concerned team of the three should be the Dallas Stars, who find themselves having the second worst save percentage at 5v5 in the entire NHL. They lead only the lowly Calgary Flames in this department while the teams directly ahead of the Stars are the Edmonton Oilers and the Carolina Hurricanes. This isn’t exactly a group you want to be mentioned with in any facet if you’re hoping to make a Cup run.

Only one team has made it out of the first round of the playoffs in the last five seasons after finishing in the bottom three teams in the league in save percentage. That team was the 2010-2011 Tampa Bay Lightning after picking up Dwayne Roloson from the Islanders earlier in the year. They Lightning ultimately lost in the Eastern Conference Final to the eventual Stanley Cup champion Boston Bruins. “Rolly the goalie” played one more season with the Lightning, posting an .886 and never playing professional hockey again.

Of the 51 teams to finish in the bottom ten in save percentage in the last five seasons – a three way tie caused the extra team in there – only 15 have made the playoffs. That means that over 70% of those teams don’t make the playoffs, let alone make a run at a Stanley Cup. On average, three of these ten teams make the playoffs every season. This year the three teams have already been decided with the Sharks, Ducks and Stars already clinching spots and the other seven teams mathematically eliminated from contention (aside from the Hurricanes, but for all intents and purposes they’re eliminated.)

Before I began researching this, I thought the Ducks had the best chance of taking out the L.A. Kings in a seven game playoff series. While I still think this would be the best series since the Blackhawks/Kings Western Conference Finals in the 2014 playoffs, I would now expect the Kings to win. The Ducks currently sit in 21st in league save percentage while the Kings are 10th. Combine that with Quick’s experience over John Gibson and you have a clear advantage for the Kings in the goaltending department, but you already knew that. Gibson has taken over for the Ducks, but he hasn’t exactly been dominant either with an even strength save percentage of .919. Compare that to Quick’s .927 and the Kings have a significant advantage. Gibson’s .919 mark comes in around the area of Jimmy Howard and Scott Darling, while Quick’s .927  is sandwiched between Jake Allen and Tuukka Rask.

The San Jose Sharks, like the Stars, don’t have a definitive number one goaltender but I trust their duo of Martin Jones/James Reimer much more than the Stars duo of Kari Lehtonen/Antti Niemi. In saying that, I don’t see either of those teams making it out of the second round.

Ironically, if the playoffs started today the Ducks and Sharks would face off in a first round match-up. This would be a very entertaining series to watch and there could be a goaltending carousel. Both teams would have two capable goaltenders dressed each. Gibson/Frederik Andersen for the Ducks and Reimer/Jones for the Sharks. We could potentially see four different goaltenders start multiple games in this hypothetical series.

Teams like the Dallas Stars can mask their goaltending issues with goal scoring during the regular season, but recent years show they will have a tough time overcoming their goaltending woes in the playoffs.

*For this chart, the goal is for both bars to be low. The Stars goaltending just isn’t going to cut it.

chart

1-2-3 Let’s Have Fun: Getting Started With Hockey Analytics

Hockey analytics are for anyone who wants them.

First things first: you can enjoy a hockey game with or without analytics. Knowing your team is getting horrendously outshot does not mean you can’t enjoy a gorgeous breakaway goal, or no-look pass, or a clean hip-check along the boards.

Analytics answer questions. They don’t necessarily tell us who will win, but they help us understand why a team might. If the top scorer in the league will get that many goals next season. Who ought to stay on a roster and who ought to go. Whether or not you should pick that guy up in your keeper league. It’s a place to begin.  Continue reading “1-2-3 Let’s Have Fun: Getting Started With Hockey Analytics”

Corsi and Cooking

EP: This post will differ from my usual in terms of content and style. I typically jot down these sorts of thoughts on Twitter, but figured this might be a better venue.

Cooking is a passion of mine. For a long while, it was also an occupation. I started the way most do in that world: washing dishes for minimum wage at the ripe age of 15. My CV was bare for a complete lack of experience, save for vague promises of being a quick learner and such. As it happens, I would live up to that claim. I had climbed and, at times, stumbled through the ranks to earn a job at one of Canada’s foremost gastronomic destinations before I had finally had enough. Despite my divorce from cooking as a profession, it remains part of my life and story. It’s common for people to discern connections between various elements important to their lives, and I’m no different. Lately, I’ve become increasingly aware of such parallels between cooking and hockey. Continue reading “Corsi and Cooking”

Who Is the NHL’s Human Highlight Reel?

Right around the time I began constructing my scraper, An idea struck me while watching a game on the league’s streaming service (formerly known as) GameCenter Live. The GameCenter video player includes markers indicating the time at which certain events of interest occurred and allows users to jump to these highlights. It had not occurred to me until then that this information must reside somewhere in the NHL.com site that can potentially be accessed. This data would eventually be collected by my scraper and stored in the Corsica database.

Highlights are comprised of goals and shots on goal. All goals are highlights, but only some shots are labelled as such. Unfortunately, I don’t know what criteria are considered in labelling these events. I imagine the process is very subjective and likely influenced in significant fashion by bias. The only thing we can ascertain is that somebody decided these events were worth categorizing as “highlights.” I haven’t yet delved into this information in great detail but I have pondered its potential uses. I’m particularly curious to know whether these data can be employed to introduce a human element to generalized scoring chance definitions. More specifically, can they indicate quality shots that are taken outside of the traditional high-danger areas? That’s a question for another day. In the meantime, we can answer a simpler and substantially more fun question. Who is the NHL’s Human Highlight Reel? Continue reading “Who Is the NHL’s Human Highlight Reel?”

Shot Quality and Expected Goals: Part I

Shot quality is a polarizing issue within the hockey stats community. Its relevance and value has been examined in various ways by many people and debated endlessly. To avoid a history lesson, I’ll keep the introduction to this topic brief, but I recommend conducting some additional research to anybody interested in learning more. It’s foremost important to understand nobody (worth listening to) has or will argue that shot quality does not exist. That some shots are better1Let’s get this out of the way early. “Better” in this article will refer to a greater probability of becoming a goal. than others is a core tenet of hockey and indeed any such sport. Questions like “What makes a shot better?” or “Can players have a sustainable influence on shot quality?” are much more interesting questions. As is often the case with such things, answering these questions can prove tricky.

It is by virtue of work done by Eric Tulsky and others that we’ve come to question the importance of shot quality in our analysis, and it is by virtue of our intuition that we continue to pursue a better shot quality formula despite this.  Continue reading “Shot Quality and Expected Goals: Part I”

References   [ + ]

1. Let’s get this out of the way early. “Better” in this article will refer to a greater probability of becoming a goal.

Hockey and Euclid: Calculating Statistical Similarity Between Players

EP: This is a less technical adaptation of the original Hockey and Euclid guest post on WAR On Ice. The underlying math will be discussed briefly in the footnotes.

Spatial reasoning is an innate characteristic in humans. It allows us to intuit conclusions from imagery, which may be exploited by graphical representation of data.1For my money, Micah McCurdy belongs in a class of his own when it comes to hockey-related data viz. You can donate to his cause on Patreon. You’ve no doubt inadvertently benefited from this fact if you’ve ever gleaned information from a chart or visualization. Elements like proximity between points are more easily interpreted in this fashion than they are through the examination of numeric data. In many ways, this idea was the first building block of what would become a generalized method of computing statistical similarity between hockey players. Continue reading “Hockey and Euclid: Calculating Statistical Similarity Between Players”

References   [ + ]

1. For my money, Micah McCurdy belongs in a class of his own when it comes to hockey-related data viz. You can donate to his cause on Patreon.